22 July 2026
Model Evaluation for Coarse and Fine Grain Image Classification on IMAGENET
Comparing ResNet and Classical ML Models on Coarse and Fine Grain Classification
Introduction
This report presents a comparative analysis of three machine learning approaches for image classification across two tasks: a coarse-grained classification task involving images of visually distinct animal classes, and a fine-grained classification task involving images of visually similar bird species.
The models evaluated are Multinomial Logistic Regression, a Support Vector Machine with a Radial Basis Function (RBF) kernel, and an ImageNet-pretrained ResNet-50 convolutional neural network. The report also examines the effect of different feature representations, including the provided colour histogram, HOG-PCA and additional features, alongside engineered features.
A major focus of this report is understanding how model complexity and feature representation affect performance as classification progresses from coarse-grained to fine-grained visual recognition. Bias-variance control techniques, including regularisation, cross-validation and dimensionality reduction, are also considered.
Methodology
Datasets
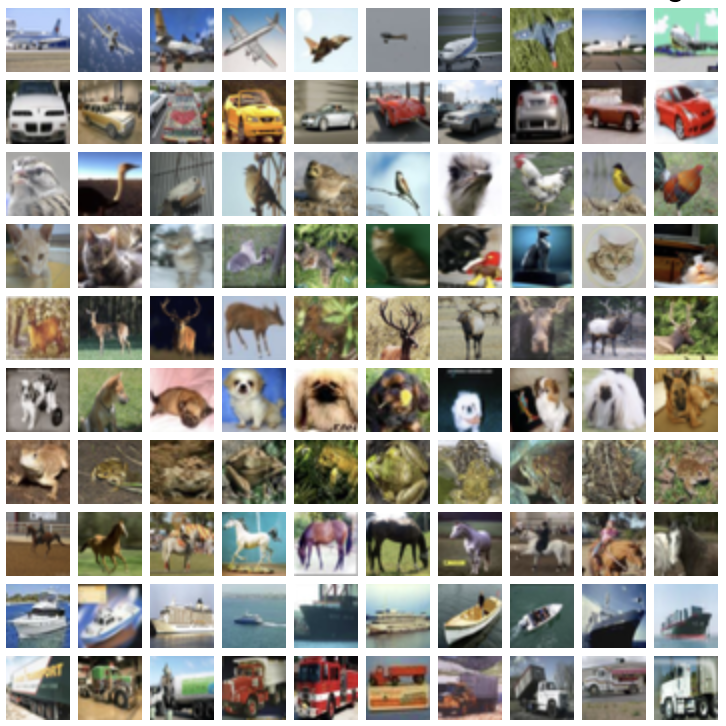
Task 1 uses 3,750 training instances of ten animal classes from the CIFAR-10 dataset, resized to 64×64 pixels. The training set is sufficiently large, and the classes are visually distinct.
Task 2 uses 417 training instances of ten bird species from the CUB-200-2011 dataset. This task represents a fine-grained classification problem, where classes differ only in subtle visual details such as colour patterns and markings.
Task 2 is expected to be more difficult due to the higher visual similarity between classes and the smaller dataset size.
Figure: There are fewer instances of Cardinal, which may lead to class imbalance
- Source image:
task2_training_class_distribution.png
Feature Engineering
In addition to the provided colour histogram, HOG-PCA and statistical features, handcrafted features were extracted from the raw images to capture complementary colour, texture and structural information.
The feature set followed descriptors recommended by Hallur and Gavade. Colour descriptors summarised RGB and HSV distributions using statistical moments, while grayscale statistics captured intensity complexity through measures such as entropy, energy and contrast. GLCM texture descriptors were also extracted to model local spatial relationships between neighbouring pixels.
Geometry-based features were excluded because they require reliable object segmentation and are less suitable for natural images.
Models
Three models were evaluated: two tabular models—Multinomial Logistic Regression and RBF-kernel Support Vector Machines (SVMs)—and an ImageNet-pretrained ResNet-50. The tabular models used the provided and extracted feature columns as input, while ResNet-50 was trained directly on the raw images.
Multinomial logistic regression was used as a baseline to assess linear separability of the features. Its main hyperparameter was the inverse regularization strength C, where lower values indicate stronger regularization.
To capture potential non-linear relationships, an SVM with an RBF kernel was trained. The key hyperparameters tuned were the inverse regularization strength C and γ, which controls the influence radius of training examples.
The final model was an ImageNet-pretrained ResNet-50. The ResNet-50 model uses a learned visual feature representation followed by a softmax classification head, allowing comparison with softmax logistic regression. Training was performed in two stages: first, the pretrained backbone was frozen and only the classification head was trained; then, the later backbone layers were fine-tuned using a smaller learning rate. Pretraining was expected to reduce overfitting, particularly for the smaller Task 2 dataset.
Evaluation
For the tabular models, we used three feature sets, the provided features (P), custom extracted features (C), and a combined feature set (P+C), to see if model performance improved after adding additional features.
Model performance was evaluated using accuracy and macro F1-score. Accuracy gives an overall measure of correctness, while macro F1-score gives equal weight to each class and is therefore more informative when class performance is uneven.
For the feature-based models, an 80/20 stratified train-validation split was used so that class proportions were preserved in both sets. To reduce dependence on one particular split, the final pipeline repeated this process across multiple random seeds and averaged the results. Learning-curve experiments were also run using 10%, 20%, 30%, 50%, 70%, and 100% of the post-split training set, allowing the effect of training-set size to be analysed.
Hyperparameters were tuned using stratified K-fold cross-validation. Cross-validation was scored using macro F1-score. Task 1 used 5-fold cross-validation because it had more training examples, while Task 2 used 3-fold cross-validation because its smaller dataset made larger numbers of folds less stable.
Confusion matrices were generated to inspect class-level errors and identify commonly confused classes. Bias-variance behaviour was analysed using training and validation scores: low training and validation scores indicated underfitting, while a large gap between training and validation scores indicated overfitting. The learning-curve and repeated-split plots were used to support this analysis.
Results
Task 1: Coarse-Grained Animal Classification
Task 1 results.
| Model | Feat. | Val. Acc. | Macro F1 |
|---|---|---|---|
| ResNet-50 | R | 0.805 | 0.802 |
| LogReg | C+P | 0.552 ± 0.027 | 0.551 ± 0.026 |
| RBF SVM | C+P | 0.533 ± 0.015 | 0.536 ± 0.015 |
| RBF SVM | P | 0.530 ± 0.019 | 0.532 ± 0.019 |
| LogReg | P | 0.521 ± 0.020 | 0.521 ± 0.023 |
| RBF SVM | C | 0.440 ± 0.008 | 0.440 ± 0.008 |
| LogReg | C | 0.427 ± 0.017 | 0.426 ± 0.017 |
For Task 1, logistic regression and RBF SVM performed similarly when using the provided feature set, with logistic regression achieving 0.521 validation accuracy and RBF SVM achieving 0.530. Combining provided and custom features improved performance slightly, with logistic regression reaching the best non-ResNet result of 0.552 validation accuracy and 0.551 macro F1.
Task 2: Fine-Grained Bird Classification
Task 2 results.
| Model | Feat. | Val. Acc. | Macro F1 |
|---|---|---|---|
| ResNet-50 | R | 0.821 | 0.819 |
| LogReg | C | 0.352 ± 0.050 | 0.343 ± 0.047 |
| LogReg | C+P | 0.335 ± 0.040 | 0.319 ± 0.044 |
| RBF SVM | C | 0.305 ± 0.014 | 0.290 ± 0.021 |
| RBF SVM | C+P | 0.282 ± 0.054 | 0.270 ± 0.053 |
| RBF SVM | P | 0.273 ± 0.049 | 0.266 ± 0.049 |
| LogReg | P | 0.269 ± 0.037 | 0.265 ± 0.037 |
For Task 2, the custom feature set performed better than the provided feature set for both logistic regression and RBF SVM. Logistic regression with custom features achieved the best non-ResNet result, with 0.352 validation accuracy and 0.343 macro F1. However, combining custom and provided features did not improve performance for Task 2, suggesting that the added provided features may not have contributed useful fine-grained information.
Without feature selection, ResNet-50 achieved the strongest performance on both tasks, reaching a validation accuracy of 0.805 and macro F1 of 0.802 for Task 1, and 0.821 validation accuracy with 0.819 macro F1 for Task 2. This suggests that the raw image-based representation learned by ResNet-50 was substantially more effective.
Feature Selection
Mutual information (MI) was used to rank features because the target variable is a multiclass categorical label and the relationship between features and classes may be nonlinear. Pearson correlation was not used because it measures linear association between numeric variables and would incorrectly treat class IDs as ordered continuous values.
Figure: The top 25 features for Task 1
- Source image:
task1_provided_custom_feature_scores_top25.png
Figure: The top 25 features for Task 2
- Source image:
task2_provided_custom_feature_scores_top25.png
Task 1 showed a much stronger dependence on texture-based features, with GLCM measures and grayscale statistics ranking highly, while Task 2 relied more on colour distributions, skewness-based statistics, and HOG/PCA shape information.
Based on ANOVA F-scores, the top 100 features were selected separately within each task from the relevant feature set. These selected feature subsets were then used to train the RBF SVM and softmax logistic regression models. Feature selection was implemented inside the training pipeline, ensuring that the selector was fitted only on the training data within each split or cross-validation fold.
Figure: Feature selection performance
- Panel 1: Task 1 — source image:
output (1).png - Panel 2: Task 2 — source image:
output (2).png
For Task 1, both RBF SVM and softmax logistic regression showed modest improvements in validation accuracy when selected features were used, suggesting that feature selection helped reduce noise and improve generalisation. In contrast, Task 2 exhibited slight performance declines for both models with feature selection, indicating that the removed features may still contain task-relevant information. However, the overlapping standard deviation ranges across all experiments suggest that these differences are relatively small and may not be statistically significant.
Confusion Matrix Analysis - Task 1
Figure: Multinomial Logistic Regression
- Source image:
lrcm.png
Figure: SVM
- Source image:
svmcm.png
Figure: ResNet-50
- Source image:
resnetcm.png
For Task 1, most classification errors occurred between visually similar animal categories such as cat and dog, or deer and horse. These classes share similar body shapes and textures, making them more difficult to separate using handcrafted statistical features alone. In contrast, visually distinct classes such as elephant and butterfly achieved much higher classification accuracy across all models.
ResNet-50 produced substantially cleaner confusion matrices with fewer systematic misclassifications. The convolutional architecture was better able to capture local spatial patterns, fine texture information, and hierarchical visual representations directly from the raw images.
Confusion Matrix Analysis - Task 2
Figure: Multinomial Logistic Regression
- Source image:
task2_provided_custom_best_softmax_logistic_regression_confusion_matrix.png
Figure: ResNet-50
- Source image:
resnetcm2.png
For Task 2, confusion was substantially higher because several bird species shared similar colour distributions and body structure. The feature-based models frequently confused Herring Gull with Ring-billed Gull (the referenced figure) and House Sparrow with Song Sparrow (the referenced figure), as these species differ mainly in subtle local markings and texture patterns that are difficult to capture using handcrafted features.
Figure: Example confusion between visually similar gull species.
- Panel 1: Herring Gull — source image:
train_Herring_Gull_0002_true-3_pred-6.png - Panel 2: Ring-billed Gull — source image:
train_Ring_billed_Gull_0040_true-6_pred-3.png
Figure: Example confusion between visually similar sparrow species.
- Panel 1: House Sparrow — source image:
train_House_Sparrow_0002_true-4_pred-7.png - Panel 2: Song Sparrow — source image:
train_Song_Sparrow_0037_true-7_pred-4.png
Final Model Selection
For Task 1, logistic regression using the combined provided and custom feature set was selected as the best feature-based model because it achieved the highest validation accuracy and macro F1-score among the tabular approaches. Although the RBF SVM captured nonlinear relationships, its improvements were relatively small compared with logistic regression.
For Task 2, logistic regression with the custom feature set produced the strongest feature-based performance. The handcrafted colour and texture descriptors appeared more informative than the provided features for distinguishing visually similar bird species.
Overall, ResNet-50 was selected as the final submission model for both tasks because it substantially outperformed all feature-based approaches. The pretrained convolutional architecture learned more effective visual representations directly from the images and generalised particularly well to the fine-grained bird classification task.
Discussion and Critical Analysis
Coarse vs Fine-Grained Classification
The results demonstrate that fine-grained image classification is substantially more difficult than coarse-grained classification. In Task 1, the animal categories differed strongly in shape, texture and colour distribution, making them easier to separate using handcrafted features and relatively simple decision boundaries. In contrast, the bird species in Task 2 shared highly similar global appearance and differed only in subtle local patterns such as wing markings, head colouration and beak structure.
The smaller training dataset in Task 2 further increased difficulty because the models had fewer examples from which to learn class-specific visual patterns. This limitation particularly affected the feature-based models, which relied heavily on manually designed descriptors that may not fully capture fine-grained visual distinctions.
Feature Representation Analysis
Handcrafted features performed reasonably well for Task 1 because coarse-grained classification depends heavily on broad colour distributions, texture statistics and overall structural differences. Features such as GLCM texture descriptors and grayscale statistics were therefore sufficient to separate many animal classes.
However, these handcrafted representations were less effective for Task 2. Fine-grained bird classification requires highly localised and hierarchical visual information that cannot easily be represented using global summary statistics. Although HOG-PCA and colour descriptors captured some shape and colour variation, they were unable to fully distinguish visually similar bird species.
ResNet-50 achieved substantially stronger performance because convolutional neural networks automatically learn hierarchical feature representations from raw images. Earlier layers capture edges and textures, while deeper layers learn more abstract semantic structures. Transfer learning from ImageNet also provided strong general visual representations that improved generalisation despite the limited dataset size.
Model Complexity and Generalisation
Logistic regression consistently showed signs of underfitting, particularly on Task 2, because its linear decision boundaries could not fully separate complex feature distributions. The RBF SVM reduced this limitation by modelling nonlinear relationships, although its performance gains remained relatively modest.
ResNet-50 had significantly higher representational capacity and achieved the best overall performance. However, deeper models are not automatically superior. Without transfer learning or sufficient regularisation, a high-capacity neural network trained on a small dataset would likely overfit severely. The pretrained backbone and staged fine-tuning process were therefore important for controlling variance and improving generalisation.
Conclusion
This report compared feature-based machine learning models and a pretrained ResNet50 across coarse-grained and fine-grained image classification tasks. The results showed that fine-grained classification was substantially more difficult because visually similar bird species differed only in subtle local patterns.
Among the feature-based methods, logistic regression generally performed better than the RBF SVM when combined with engineered colour and texture descriptors. However, both approaches were limited by their reliance on handcrafted features.
ResNet50 achieved the strongest performance on both tasks by learning hierarchical visual representations directly from raw images. Transfer learning from ImageNet also improved generalisation, particularly for the smaller fine-grained dataset.
Overall, the experiments demonstrate that while handcrafted features can perform reasonably well for simpler coarse-grained problems, pretrained convolutional neural networks are substantially more effective for complex image classification tasks.
References
- Erick da Silva Puls, Matheus V. Todescato, and Joel L. Carbonera. 2023. An evaluation of pre-trained models for feature extraction in image classification.
- S. Hallur and A. Gavade. 2025. Feature extraction techniques in image processing. Franklin Open, 12:100366.
- A. Krizhevsky. 2009. Learning multiple layers of features from tiny images. Technical report, University of Toronto.
- F. Pedregosa, G. Varoquaux, A. Gramfort, V. Michel, B. Thirion, O. Grisel, M. Blondel, P. Prettenhofer, R. Weiss, V. Dubourg, J. Vanderplas, A. Passos, D. Cournapeau, M. Brucher, M. Perrot, and E. Duchesnay. 2011. Scikit-learn: Machine learning in Python. Journal of Machine Learning Research, 12:2825–2830.
- C. Wah, S. Branson, P. Welinder, P. Perona, and S. Belongie. 2011. The Caltech-UCSD Birds-200-2011 dataset. Technical Report CNS-TR-2011-001, California Institute of Technology.
AI Declaration
Generative AI tools were used during this assignment to support both report writing and coding tasks. This included assistance with brainstorming ideas, refining explanations, improving code efficiency and readability, debugging, and editing sections of the report for clarity and structure. All core implementation, experimentation, analysis, and final decisions were completed and verified by me, and I take full responsibility for the submitted work.